BHEL
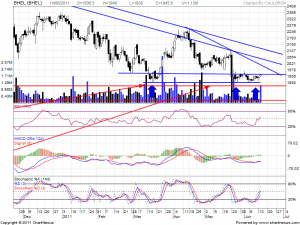
BHEL has been trading range of 1894-1950 in daily chart. Stock is now trading in upper end of range @1950 and with volumes above average.
RSI and Stochastic is generating BUY.
Buy above 1950 Tgt 1960,1973 and 1982
Sell below 1941 Tgt 1934,1922 and 1915
Kotak Bank
Kotak forming a symmetrical triangle with a Negative divergence in RSI.
Divergence should not be traded till we see the price confirming the downside move.Buy above 452 Tgt 455,458 and 462


No comments:
Post a Comment