Tuesday, June 28, 2011

Stock of the day : Hero Honda (buy)


Hero Honda was trading in a narrow range towards the end of yesterday’s session, and could resume its rally with market conditions remaining bullish today. It is a buy recommendation with a stop loss below 1,830. It would be best bought below 1,865.
The chart above is a 3-day 15 minutes intra-day chart for Hero Honda.

Day Trading Guide 29-06-2011


DLF
As long as DLF trades below Rs 215, its near-term outlook remains bearish. We recommend a sell in the stock with tight stop-loss at Rs 215 levels.
ICICI Bank
The stock is currently testing its 200-day moving average. Fresh long position is recommended only if the stock moves beyond Rs 1,094 levels with tight stop-loss.
Infosys
Make use of dips to buy the stock while maintaining stiff stop-loss at Rs 2,845 levels.
L&T
Initiate fresh short position only if the stock fails to move above Rs 1,814 levels with stiff stop-loss.
ONGC
Fresh short position can be initiated only if the counter dives below Rs 280 levels with tight stop-loss.
Reliance Industries
In the past three trading session, RIL has been moving sideways in a narrow band. Desist trading in the stock for the session as the near-term stance is watchful.
SBI
Initiate fresh short position if SBI fails to exceed beyond Rs 2,362 levels with tight stop-loss.
Tata Motors
Fresh long position is recommended only if Tata Motors surges above Rs 999 levels with fixed stop-loss.
Tata Steel
Initiate fresh long position if the counter reverses higher from Rs 580 levels with tight stop-loss.
Nifty Futures
Nifty futures was volatile and ended higher by almost 15 points in the last trading session. Fresh long position can be initiated only if Nifty Futures moves beyond 5600 levels with stiff stop-loss

Nifty Future 29-6-2011


Nifty must be continue for up move with 5532-5539 support (If nifty sustain above 5532 for whole trading day…then Targets will 5592-5621 easily)

Suppose to break it…then….
Intraday support 5492-5517 for target of up as 5561-5581-5604
Trading 5492 below for 10-15mintues will be fall as expected 5434-5428-5398

Yes, you have good resistance 5558-5578 from where fall can expected…!!!

nifty reliance tata motors


Daily Market Report for Tuesday (June 28, 2011)


Daily Market Report for Tuesday (June 28, 2011)

Uptrend Continues...


Review of the Previous day: 
The Nifty rose substantially on Monday (June 27, 2011) a net 55.35 points (1.01%) and closed at the 5526 point level. The market opened down with a gap at the 5441 points level on weak global cues. It then declined further and registered the day’s low at the 5434 points level at 9.16 a.m. It then rose sharply into the green and registered the day’s high at the 5552 points level at 1.21 p.m. It then declined marginally and turned into a range bound movement until closing at the day. Sentiment was bullish and amongst the 50 Nifty stocks, 39 were gainers, while 11 were losers. The index rose for the third consecutive session and closed above the psychologically important 5500 points level. Heavy buying was witnessed in capital goods, banking, auto and oil & gas stocks, while some selling was witnessed in realty, FMCG, and consumer durables stocks.
Technical Analysis:
Volume (Qty shares) decreased 6.37%. This change is small and indicates a moderate participation by investors.
Market Breadth: Overall Market Breadth on the NSE was positive. Amongst all the traded stocks, 868 were gainers, 520 were losers and 66 remained unchanged.
Slow Stochastic Indicator: The Slow Stochastic Oscillator has risen in the neutral zone. The Slow K line in the Stochastic Oscillator is above the slow D line (positive if it continues).
RSI Indicator: The RSI is above the 40 level and is now rising (positive if it continues).
MACD Indicator: The MACD is below zero but is now rising (positive if it continues). It has crossed above its 9-day Average (positive and a buy signal).
ADX Indicator & DI Lines: The +DI line is above the –DI line and both lines are diverging (positive if it continues). The ADX is falling while the Market Index is rising, which indicates that the present up trend is decreasing in strength.
Moving Averages (Trend Indicators)
The index:
Is above its 5-day average (at 5374) Positive.
Is above its 15-day average (at 5427) Positive.
Is above its 25-day average (at 5450) Positive
Is below its 200-day average (at 5752) Negative.

All the four averages are negatively trended. Negative.
Overall Market Strength/Weakness: The indicators and oscillators discussed here are indicating astrong market with a positive bias.
Support Levels: For short-term traders the immediate main support is at 5135 marked as S1 (blue line below the Index).
The next support is at 4795 marked as S2 (blue line below the Index).
Resistance Levels: The immediate main resistance is at 5982 marked as R1 (red line above the Index).
The next resistance is at 6357 marked as R2 (red line above the Index).

Pivot Point Analysis:
 For intra-day traders the support and resistance levels are calculated according to the pivot point theory and are:
Pivot point =
5505 (This is the level where the trend is likely to change during intra-day).
Support (1) = 5456.
Support (2) = 5386.
Resistance (1) = 5575.
Resistance (2) = 5623.


Outlook for Today: On Japanese candlestick patterns the index has formed a third consecutive and long white black body candle. This is positive.
Further, the index is above the 5, 15 and 25 days moving averages. Moreover, the velocity parameters are also positively trended. Also, a buy signal has been generated on the MACD indicator. All these indicate a positive bias and the possibility of a further up move unfolding. Investors are advised to hold long positions.
Work with strict stop losses on all positions.

Monday, June 27, 2011

recommandations


Some relief!

"The greatest weapon against stress is our
ability to choose one thought over another." -
William James


The lowering crude prices has been acting as
catalyst for Indian markets to outperform the
globe, that is the reason we saw Nifty despite
opening lower closed at days high above 5,500
levels. The trend certainly seems to be on positive
side after Nifty closed above the ‘weekly hammer’
and broader markets is likely to participate in the
rally in coming days after decent cushion for
market above 5,450 levels


Bajaj Auto (SELL, below Rs1,340, Target
Rs1,280): The recent pullback in Bajaj Auto from
the low of Rs1,306, which coincided with the lower
band of Envelope fizzled out near its 200-DMA
yesterday, as despite an intra-day high of Rs1,444,
we saw the stock closing below its Friday’s low.
Historically, the stock has several times ran into its
200-DMA line and fallen back. Moreover,
appearance of falling tops signifies the bulls
inability to form higher highs. A fall below Rs1,340
could signal a trend reversal after recent pullback.
We advise going short on Bajaj Auto June
Futures below Rs1,340 with stop loss of
Rs1,365 for target of Rs1,280.
Canara Bank (BUY, between Rs515-518,
Target Rs534): Canara Bank on the daily chart
has signaled breakout from descending triangle
with spurt in volumes. So far the stock has been
underperforming the CNX Bank Index , but
however with breakout on the line chart, the stage
is set for the stock to head towards Rs 545 in the
near term The daily RSI has been corroborating
the breakout with positive crossover and also has
been making higher tops and higher bottom. On
the weekly chart ‘a Harami Cross’ pattern was
visible which is bullish pattern on the medium term
chart. We advise buying stock in the range of
Rs515-518 with stop loss of Rs510 for Target
Rs534.
.

Strategies
 Long UCO Bank July Future in range of
Rs92-92.50 for the target price of Rs97 with a
stop loss placed at Rs90.
Lot size: 2000
Remarks: Net maximum profit of Rs10,000 and
net maximum loss of Rs5,000.
 Long PFC July Future in range of Rs183-184
for the target price of Rs193 and stop loss
placed at Rs179.
Lot size: 1000
Remarks: Net maximum profit of Rs10,000 and
net maximum loss of Rs5,000.


Nifty EOD Chart 27June 2011

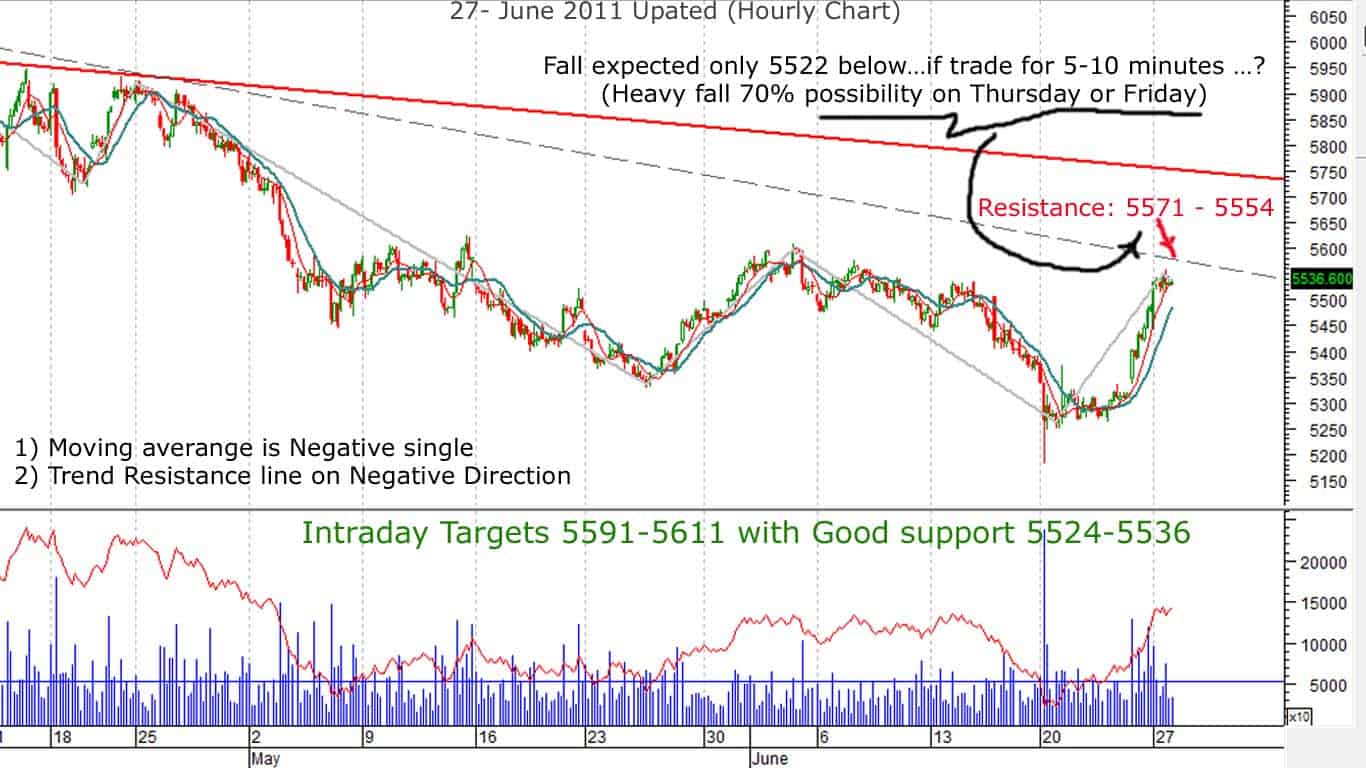
NIfty Future 28-6-2011


Just watch 5521
(For Today to test as Targets 5591-5516, Nifty Future must be trade 5521 above)
Therefore, Intraday Targets 5591-5611 with Good support 5524-5536

Resistance: 5571 – 5554
Fall expected only 5522 below…if trade for 5-10 minutes …? (Heavy fall 70% possibility on Thursday or Friday)

Technical View on:Nifty,SBI and HUL

27 JUNE 2011

Nifty Hourly

Nifty kept on its momentum build on Friday and rose another 1 % today.
On Hourly chart Resistances are @ 5565 and Mother of All Resistance 5610.
Indicators should only be used for trade confirmation .
As you can see in Hourly charts all indicators are in overbought zone and it does not imply that we need to take SHORT Trades.
Do not jump in trades based on your emotions,Enter when market gives an opportunity and wait for good Risk to Reward Ratio.
Market will not go anywhere so wait for Mr. Market to give you opportunity to make money.

Nifty Daily

On Daily Chart made an interesting observation,The last time market rose was on 01-April-10 189 points after Budget day and next day also continue its run. Same as happened Last Friday Nifty rising 150 points and continues its uptrend today also and closing off from days High.
Tomorrow if this trend continues market should close in RED.(Please do not take this as a Trading call its just an observation.)

Levels to Watch tommorow

Buy above 5526 Tgt 5552,5578 and 5610

Sell below 5405 Tgt 5383,5356 and 5330

Levels mentioned are SPOT Levels
Its an Expiry Week so keep booking profits as market will be volatile.

SBIN

SBI which has been moved almost 7% in 2 days is approaching a crucial resistance zone of 2358-2364.
SBI should close above this level for its upmove to continue.

Buy above 2329 Tgt 2349,2364

If 2364 is not broken stock can continue its downtrend again.Above 2364 stock can continue its bounce till2400

HUL


HUL is facing resistance @327 which has been a supply zone for past many many months. Risk to Reward is in favor of BEARS

Short @ 324 Tgt 320,317 and 314 SL 327

Buy @329 Tgt 332,338 and 341


Sunday, June 26, 2011

Strategies


 Long Dr Reddy June Future in range of
Rs1480-1484 for the target price of Rs1540
with a stop loss placed at Rs1454.
Lot size: 250
Remarks: Net maximum profit of Rs15,000 and
net maximum loss of Rs7,500.
 Short Reliance Infra June Future in range of
Rs532-534 for the target price of Rs514 and
stop loss placed at Rs542.
Lot size: 250
Remarks: Net maximum profit of Rs5,000 and
net maximum loss of Rs2,500.

Technicals: Day Trading Guide


DLF

Fresh long position is recommended only if DLF climbs above Rs 220 levels with tight stop-loss.

ICICI BANK

Initiate fresh short position only if the stock dives below Rs 1,050 levels with tight stop-loss.

INFOSYS

We recommend a buy with fixed stop-loss at Rs 2,840 levels.

L&T

Fresh long position can be initiated if the counter advances beyond Rs 1,750 levels with stiff stop-loss.

ONGC

The near-term stance stays positive as long as ONGC hovers above Rs 268 levels. We recommend a buy in the stock with stiff stop-loss at Rs 268 levels.

RELIANCE INDUSTRIES

Make use of dips to buy the stock while maintaining tight stop-loss at Rs 855 levels.

SBI

Fresh long position can be initiated if SBI reverses higher from Rs 2,256 levels with fixed stop-loss.

TATA MOTORS

We recommend a buy in the stock with stiff stop-loss at Rs 950 levels.

TATA STEEL

Initiate fresh long position only if Tata Steel moves beyond Rs 585 levels with tight stop-loss.

NIFTY FUTURES

On Friday, Nifty Futures jumped 167.8 points or 3 per cent accompanied by above average volumes. As long as Nifty Futures trades above 5425 levels, the near-term stance stays positive. We recommend a buy in it with tight stop-loss at 5425 levels

Thursday, June 23, 2011

Day Trading Guide


DLF
The stock was choppy and formed a spinning top candlestick pattern signalling indecisiveness in the last trading session. Desist trading in the stock for the session.
ICICI Bank
Fresh long position can be initiated if the stock reverses higher from Rs 1,018 levels with tight stop-loss.
Infosys
The near-term stance remains positive as long as the stock trades above Rs 2,752 levels. We recommend a buy in the stock with stiff stop-loss at Rs 2,752 levels.
L&T
Initiate fresh long position only if L&T moves beyond Rs 1,680 levels with tight stop-loss.
ONGC
We reiterate our buy recommendation in the counter with fixed stop-loss at Rs 260 levels.
Reliance Industries
On Thursday, RIL surged almost three per cent accompanied by average volumes. We recommend a buy in the stock with tight stop-loss at Rs 855 levels.
SBI
Initiate fresh long position only if SBI advances beyond Rs 2,182 levels with tight stop-loss.
Tata Motors
We re-state our buy recommendation in the stock with stiff stop-loss at Rs 935 levels.
Tata Steel
Fresh long position is recommended only if the counter climbs above Rs 565 levels with stiff stop-loss.
Nifty Futures
Initiate fresh long position only if Nifty Futures moves beyond 5,357 levels with tight stop-loss

Strategies


 Long Oriental Bank June Future in range of
Rs323 – 325 for the target price of Rs333 with
a Stop loss placed at Rs320.
Lot size: 500
Remarks: Net maximum profit of Rs5,000 and
net maximum loss of Rs2,500.
 Long Welspun Corporation June Future in
range of Rs155– 156 for the target price of
Rs163 with a Stop loss placed at Rs152.
Lot size: 1000
Remarks: Net maximum profit of Rs8,000 and
net maximum loss of Rs4,000.

Voltas BUY between Rs151-152, Target Rs 162

Voltas (BUY, between Rs151-152, Target Rs
162): Voltas has retreated back near its horizontal
support of Rs153 with volume activity surging five
times is 10 day average. The support of Rs152 acts
as decent cushion for the stock and any move
below Rs152 could, lead to further unwinding in
the stock till Rs147. Four weeks ago stock had
formed an ‘hammer’ pattern on weekly chart which
is a signal of major trend reversal and as long
stock honors the low of Rs147 on weekly closing
basis, probability remains high for good bounce
back. We advise buying stock in the range of
Rs151-152 with stop loss of Rs 147 for Target
of Rs162.(duration 5 days).

Info Edge (Naukri) (BUY, above Rs742,
Target Rs770): On the daily chart, the stock has
given an upside breakout, considered to be an
important bullish signal. The stock is poised for
further gains in the next few trading sessions. The
undertone is reasonably strong and is likely to
push price higher. After consolidating in the range
of Rs740-680 for last six weeks, the stock closed
around the peak of its trading range of Rs740
yesterday. The upside breakout is well
accompanied with impressive volumes. The stock
recorded two-fold delivery volumes, exceeding its
5-day average. Based on above mentioned
technical evidences, we recommend traders to
buy the stock above Rs742 with stop loss of
Rs730 for target of Rs770.

quote of the day


“You have no choices about how you lose, but
you do have a choice about how you come
back and prepare to win again.” - Pat Riley

Monday, June 20, 2011

important sites chk daily


Daily Market Report for Friday (June 17, 2011)

Weakness Persists ...

By Dominic Rebello


Review of the Previous day: 
The Nifty fell substantially on Thursday (June 16, 2011) a net 50.75 points (0.93%) and closed at the 5396 point level. The market opened down with a gap at the 5419 points level on weak global cues. It then turned into a range bound movement until 12.10 p.m. It market then rose sharply and registered the day’s high at the 5447 points level at 12.22 p.m. as the hike of 25 basis points by the RBI was factored in by the market. It then declined sharply due to weak opening in the European markets because of the Greek debt problem and registered the day’s low at the 5389 points level at 3.13 p.m. It then turned into a range bound movement until closing at the day. The Nifty remained below its previous close throughout the day and closed below the psychologically important 5400 points level. Sentiment was bearish and amongst the 50 Nifty stocks, 35 were losers, 15 were gainers. All the sectoral indices closed in the red. Heavy selling was witnessed in IT, technology, capital goods, metal, and consumer durables stocks.
Technical Analysis:
Volume (Qty shares) decreased 1.30%. This change is small and indicates a moderate participation by investors
Market Breadth: Overall Market Breadth on the NSE was negative. Amongst all the traded stocks, 422 were gainers, 967 were losers and 53 remained unchanged.
Slow Stochastic Indicator: The Slow Stochastic Oscillator has declined in the neutral zone. The Slow K line in the Stochastic Oscillator is below the slow D line (negative if it continues).
RSI Indicator: The RSI fell and crossed below the 40 level and is now declining (negative if it continues).
MACD Indicator: The MACD is below zero and is now declining (negative if it continues). It has crossed below its 9-day Average (negative and a sell signal).
ADX Indicator & DI Lines: The +DI line is below the –DI line and both lines are diverging (negative if it continues). The ADX is rising while the Market Index is falling, which indicates that the present down trend is increasing in strength.
Moving Averages (Trend Indicators)
The index:
Is below its 5-day average (at 5462) Negative.
Is below its 15-day average (at 5507) Negative.
Is below  its 25-day average (at 5479) Negative
Is below its 200-day average (at 5757) Negative.Overall Market Strength/Weakness: The indicators and oscillators discussed here are indicating a weak market with a negative bias.
Support Levels: For short-term traders the immediate main support is at 5135 marked as S1 (blue line below the Index).
The next support is at 4795 marked as S2 (blue line below the Index).
Resistance Levels: The immediate main resistance is at 5982 marked as R1 (red line above the Index).
The next resistance is at 6357 marked as R2 (red line above the Index).

Pivot Point Analysis:
 For intra-day traders the support and resistance levels are calculated according to the pivot point theory and are:
Pivot point = 5411 (This is the level where the trend is likely to change during intra-day).
Support (1) = 5375.
Support (2) = 5354.
Resistance (1) = 5433.
Resistance (2) = 5469.
(For support and resistance levels all F&O stocks refer to the Afternoon
Newspaper or Click here)

Outlook for Today: On Japanese candlestick patterns the index has formed a second consecutive but small black body candle. The body of this candle is below and outside the body of the previous black body candle. This is negative.
Further, the 5 days moving average has dropped below the 25 days moving average. The index continues to remain below the 5, 15, 25 and 200 days moving averages and all the four averages are declining. Moreover, the velocity parameters are also negatively trended. All these indicate a negative bias and the possibility of a further decline unfolding. Investors are advised to avoid buying at current levels.
Work with strict stop losses on all positions.

"I Created You" (Beautiful Message)


  I Created You 

One day, as usually, an orphan, a little girl, stood at the street corner begging for food, money or whatever she could get.
Now, this girl was wearing very tattered clothes, was dirty and quite dishevelled.

A well-to-do you man passed that corner without giving the girl a second look. But, when he returned to his expensive home, his happy and comfortable family, and his well-laden dinner table, his thoughts returned to the young orphan..
 
He became very angry with God for allowing such conditions to exist.
He reproached God, saying, "How can you let this happen ?! Why don't you do something to help this girl ?!" ...................

........... & Then he heard God in the depths of his Being responding by saying,
" I did. *I created You*. "


--
This is the ancient land where wisdom made its home before it went into any other country. Here is the same India whose soil has been trodden by the feet of the greatest sages that ever lived. This is the land whence, like tidal waves, spirituality and philosophy have again and again rushed out and deluged the world.

Wednesday, June 15, 2011

Day Trading Guide


DLF
Witnessing selling pressure DLF fell almost three per cent in the lat trading session. Utilise rallies to sell the stock while retaining tight stop-loss at Rs 230 levels.
ICICI Bank
Initiate fresh short position if the counter dives below Rs 1,020 levels with fixed stop-loss.
Infosys
Make use of rallies to sell the stock while maintaining tight stop-loss at Rs 2,850 levels.
L&T
Fresh long position can be initiated if the stock bounces up from Rs 1,697 levels with tight stop-loss.
ONGC
Initiate fresh short position if the stock reverses down from Rs 272 levels with stiff stop-loss.
Reliance Industries
We recommend a sell in RIL with stiff stop-loss at Rs 915 levels.
SBI
Initiate fresh short position if SBI drops below Rs 2,165 levels with tight stop-loss.
Tata Motors
Fresh long position can be initiated only if the counter reverses higher from Rs 981 levels with fixed stop-loss.
Tata Steel
We re-affirm our sell recommendation in the stock with stiff stop-loss at Rs 570 levels.
Nifty Futures
Nifty Futures slipped one per cent experiencing selling pressure on Wednesday. Initiate fresh short position if Nifty Futures fails to move above 5,490 levels with tight stop-loss